Introduction
Handling missing data remains one of the most crucial tasks in applied data science. Whether caused by sensor failures, survey non-responses, or data-entry mistakes, missingness can bias analyses and reduce model performance.
Simple techniques like listwise deletion often waste data. More principled strategies use imputation replacing missing values with reasonable estimates.
However, no single method performs best for all data
types or distributions. The imputetoolkit
package provides an R + C++ unified framework to
inject, impute,
evaluate, and visualize different
imputation strategies side by side.
What the Package Does
imputetoolkit performs a full imputation
benchmarking pipeline:
Controlled missingness injection
Multi-method imputation:
Mean / Mode (with skewness-aware log transform)
Median / Mode
MICE
-
KNN (parallel mixed-type imputation using
FNN)- Split evaluation of numeric and categorical features via C++ back-end
- Metric computation using Rcpp for efficiency
- Automatic best-method suggestions
- Visual comparisons (metrics + density plots)
Typical Workflow
The main entry point is the evaluator()
function:
res <- evaluator(filename = "path/to/data.csv")Internally, this function:
Loads the dataset or uses the provided data frame.
Detects numeric vs categorical columns.
Injects missing values under controlled proportions.
Performs four imputation methods (Mean/Mode, Median/Mode, MICE, KNN).
-
Evaluates each using:
- Numeric metrics: RMSE, MAE, R², Correlation, KS.
- Categorical metrics: Accuracy, Kappa, F1, Macro F1, Balanced Accuracy.
Returns a named list of
"evaluator"objects, one per method.
Example 1 - Quick Start
# Load the built-in mixed-type dataset
file <- system.file("extdata", "synthetic_mixed_dataset.csv", package = "imputetoolkit")
raw_data <- read.csv(file, stringsAsFactors = TRUE)

# Run the full evaluator pipeline
res <- evaluator(data = raw_data)
View Metrics for One Method
print(res$mean_mode)Per-Column Summary
summary(res$mean_mode)Compare All Methods (Table)
print_metrics(res)Example 2 - Split Evaluation: Numeric vs Categorical
Each imputation result now contains two separate metric groups:
names(res$mean_mode)
#> [1] "method" "metrics_numeric" "metrics_categorical"
Example numeric-metric output (truncated):
--- Numeric Metrics ---
   RMSE    MAE      R2  Correlation    KS
  0.2068  0.1750  -0.0001   0.0000   0.5068
Example categorical-metric output:
--- Categorical Metrics ---
  Accuracy  Kappa   F1  MacroF1  BalancedAccuracy
   0.2782   0.0000  0.2782  0.1295  0.2700
Example 3 - Suggesting the Best Imputation Method
# Single-metric suggestion
suggest_best_method(res, "RMSE")

# Aggregate suggestion across all metrics
suggest_best_method(res, "ALL")
Typical output:
Numeric Columns:
   Best imputation method as per "RMSE, MAE, R2, KS" metric: Mean/Mode
   Best imputation method as per "Correlation" metric: MICE

Categorical Columns:
   Best imputation method as per "Kappa" metric: KNN
   Best imputation method as per "Accuracy, F1, BalancedAccuracy" metric: Mean/Mode
   Best imputation method as per "MacroF1" metric: MICE
Example 4 - Visual Comparison of Results
The following visualizations summarize and compare the imputation performance across all methods.
Metric-Based Plots
plot_metrics(res, metric = "RMSE")            # Numeric
plot_metrics(res, metric = "Accuracy")        # Categorical
plot_metrics(res, metric = "ALL")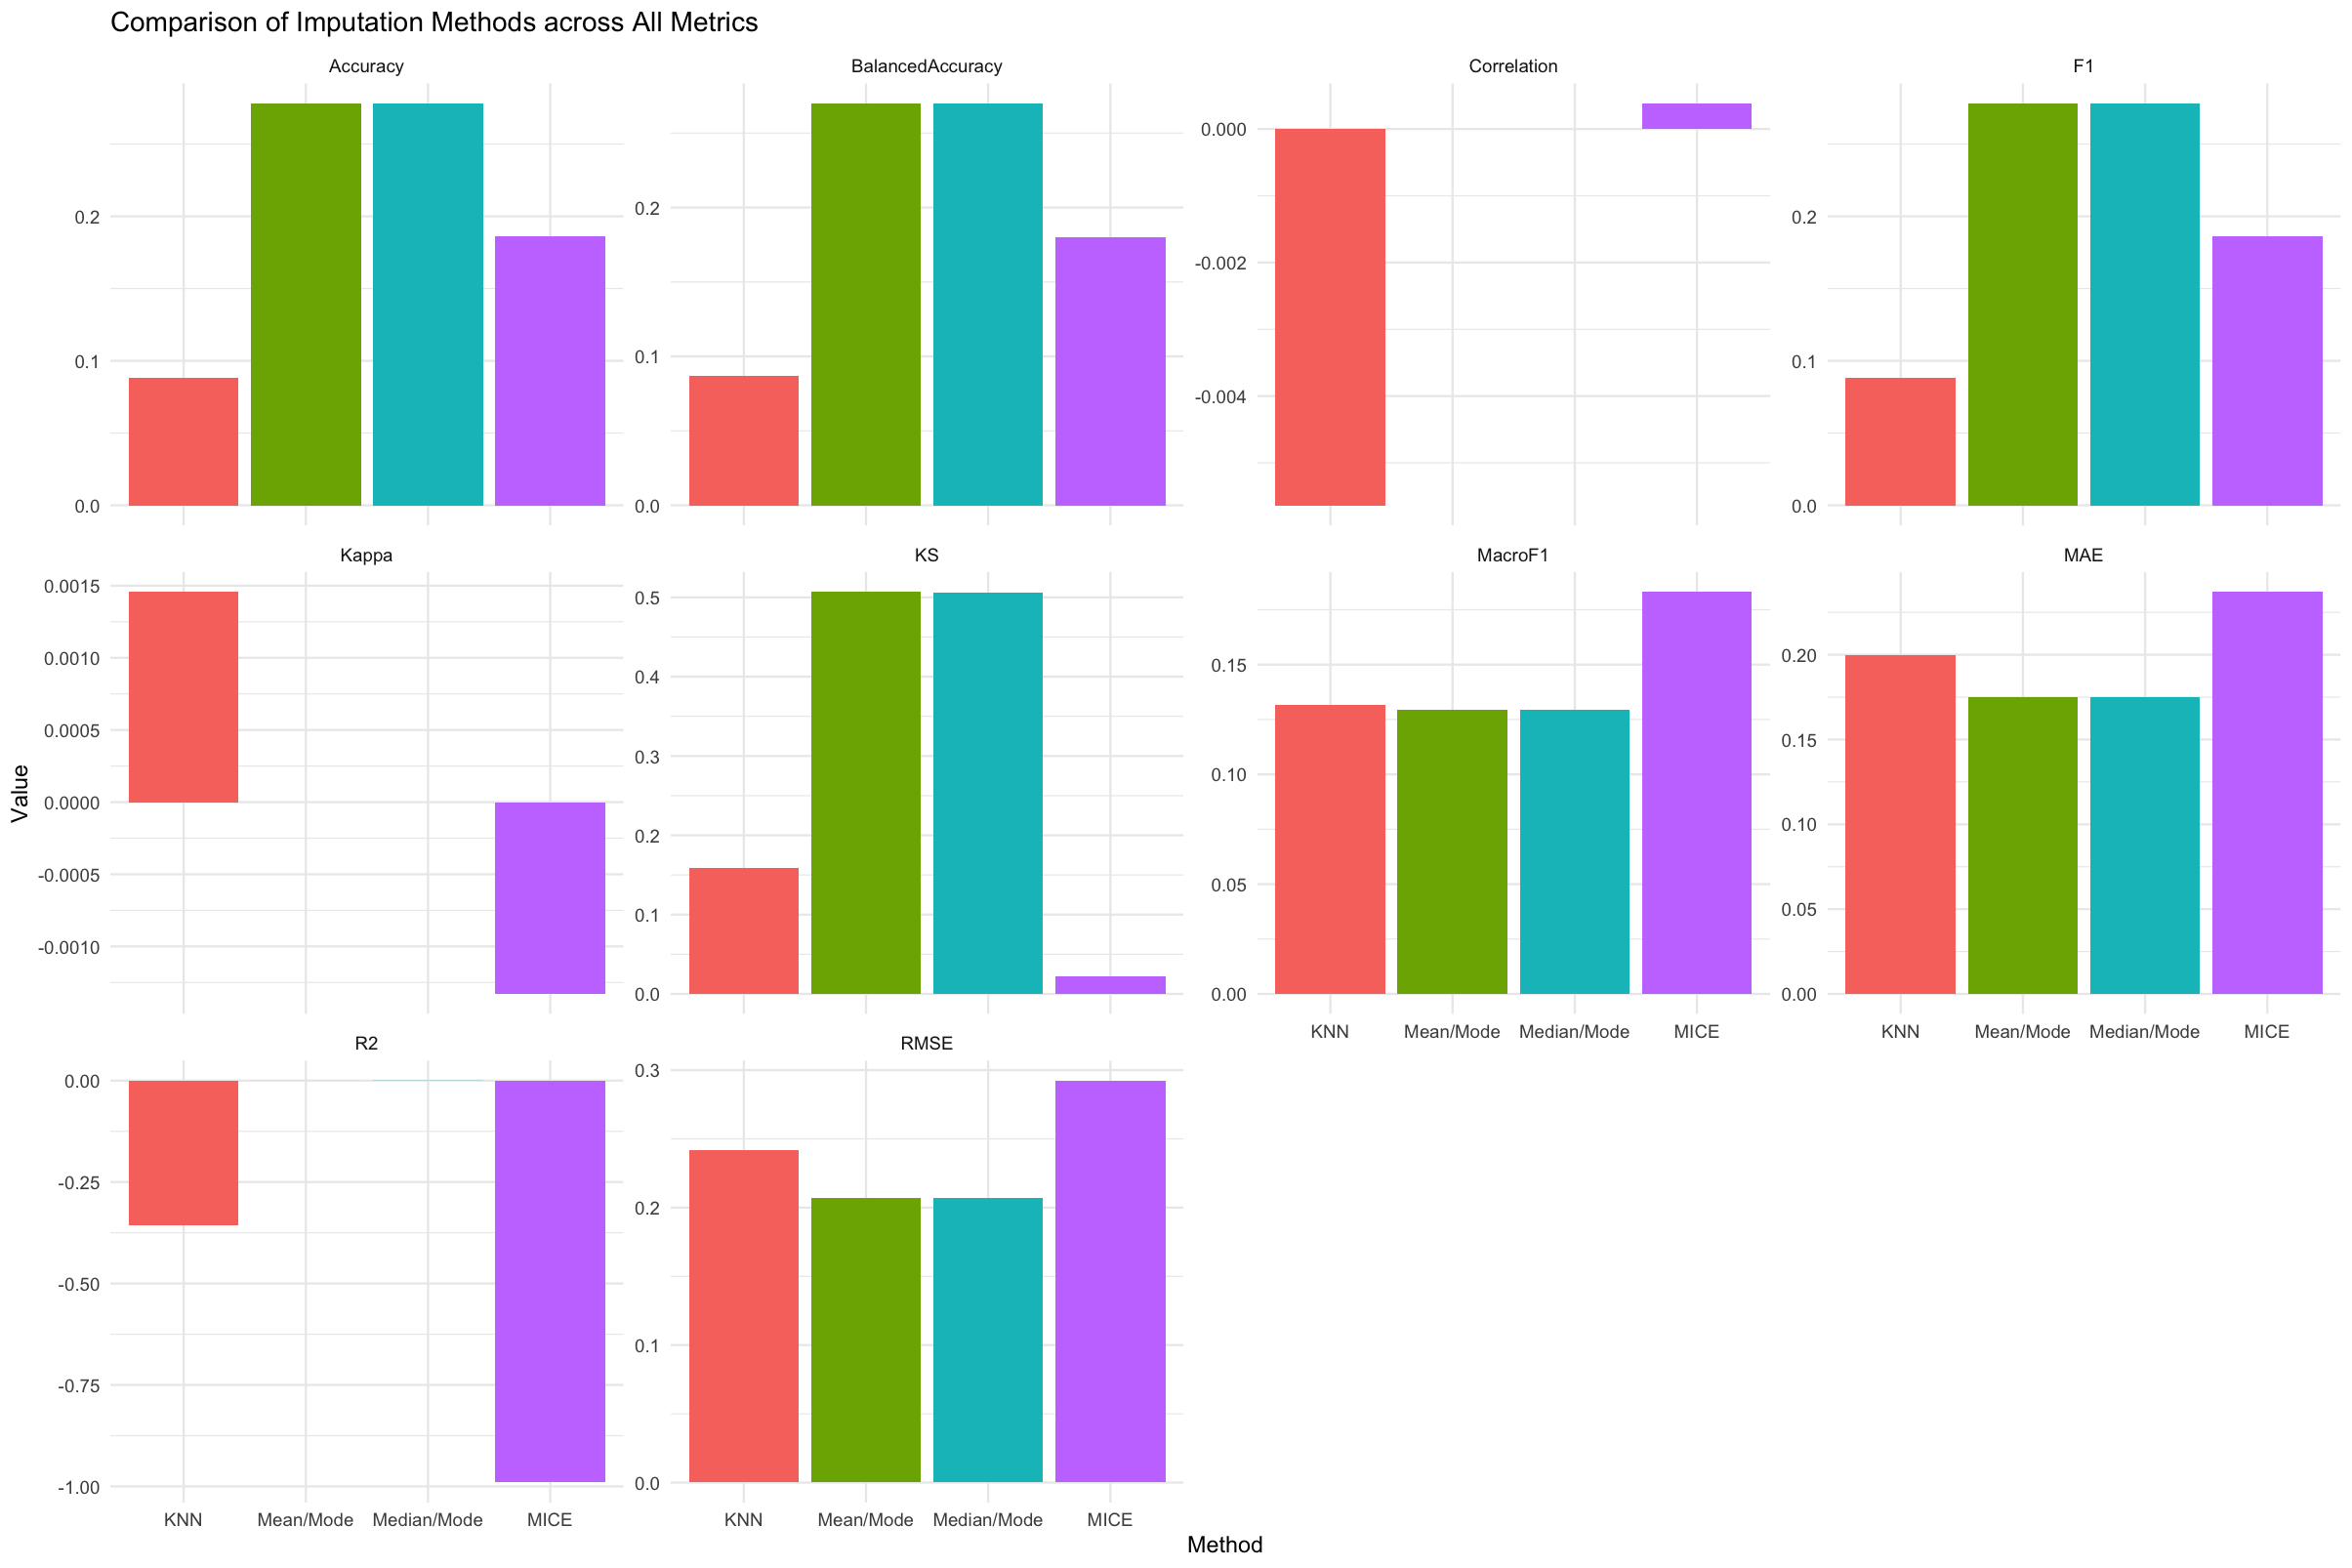
Figure 1. Comparison of four imputation methods - KNN, Mean/Mode, Median/Mode, and MICE, across both numeric and categorical evaluation metrics. Each facet represents a specific metric, with the x-axis showing the imputation methods side by side. This plot enables quick visual comparison and helps identify which method performs best overall.
Example 5 - Distributional Similarity via Density Plots
Distribution plots help verify whether imputed values preserve the shape of the original data.
Distribution overlap between true and imputed values can be visualized:
eval_list <- get_eval_list(res)

# Single column
plot_density_per_column(eval_list, "age")
plot_density_all(eval_list)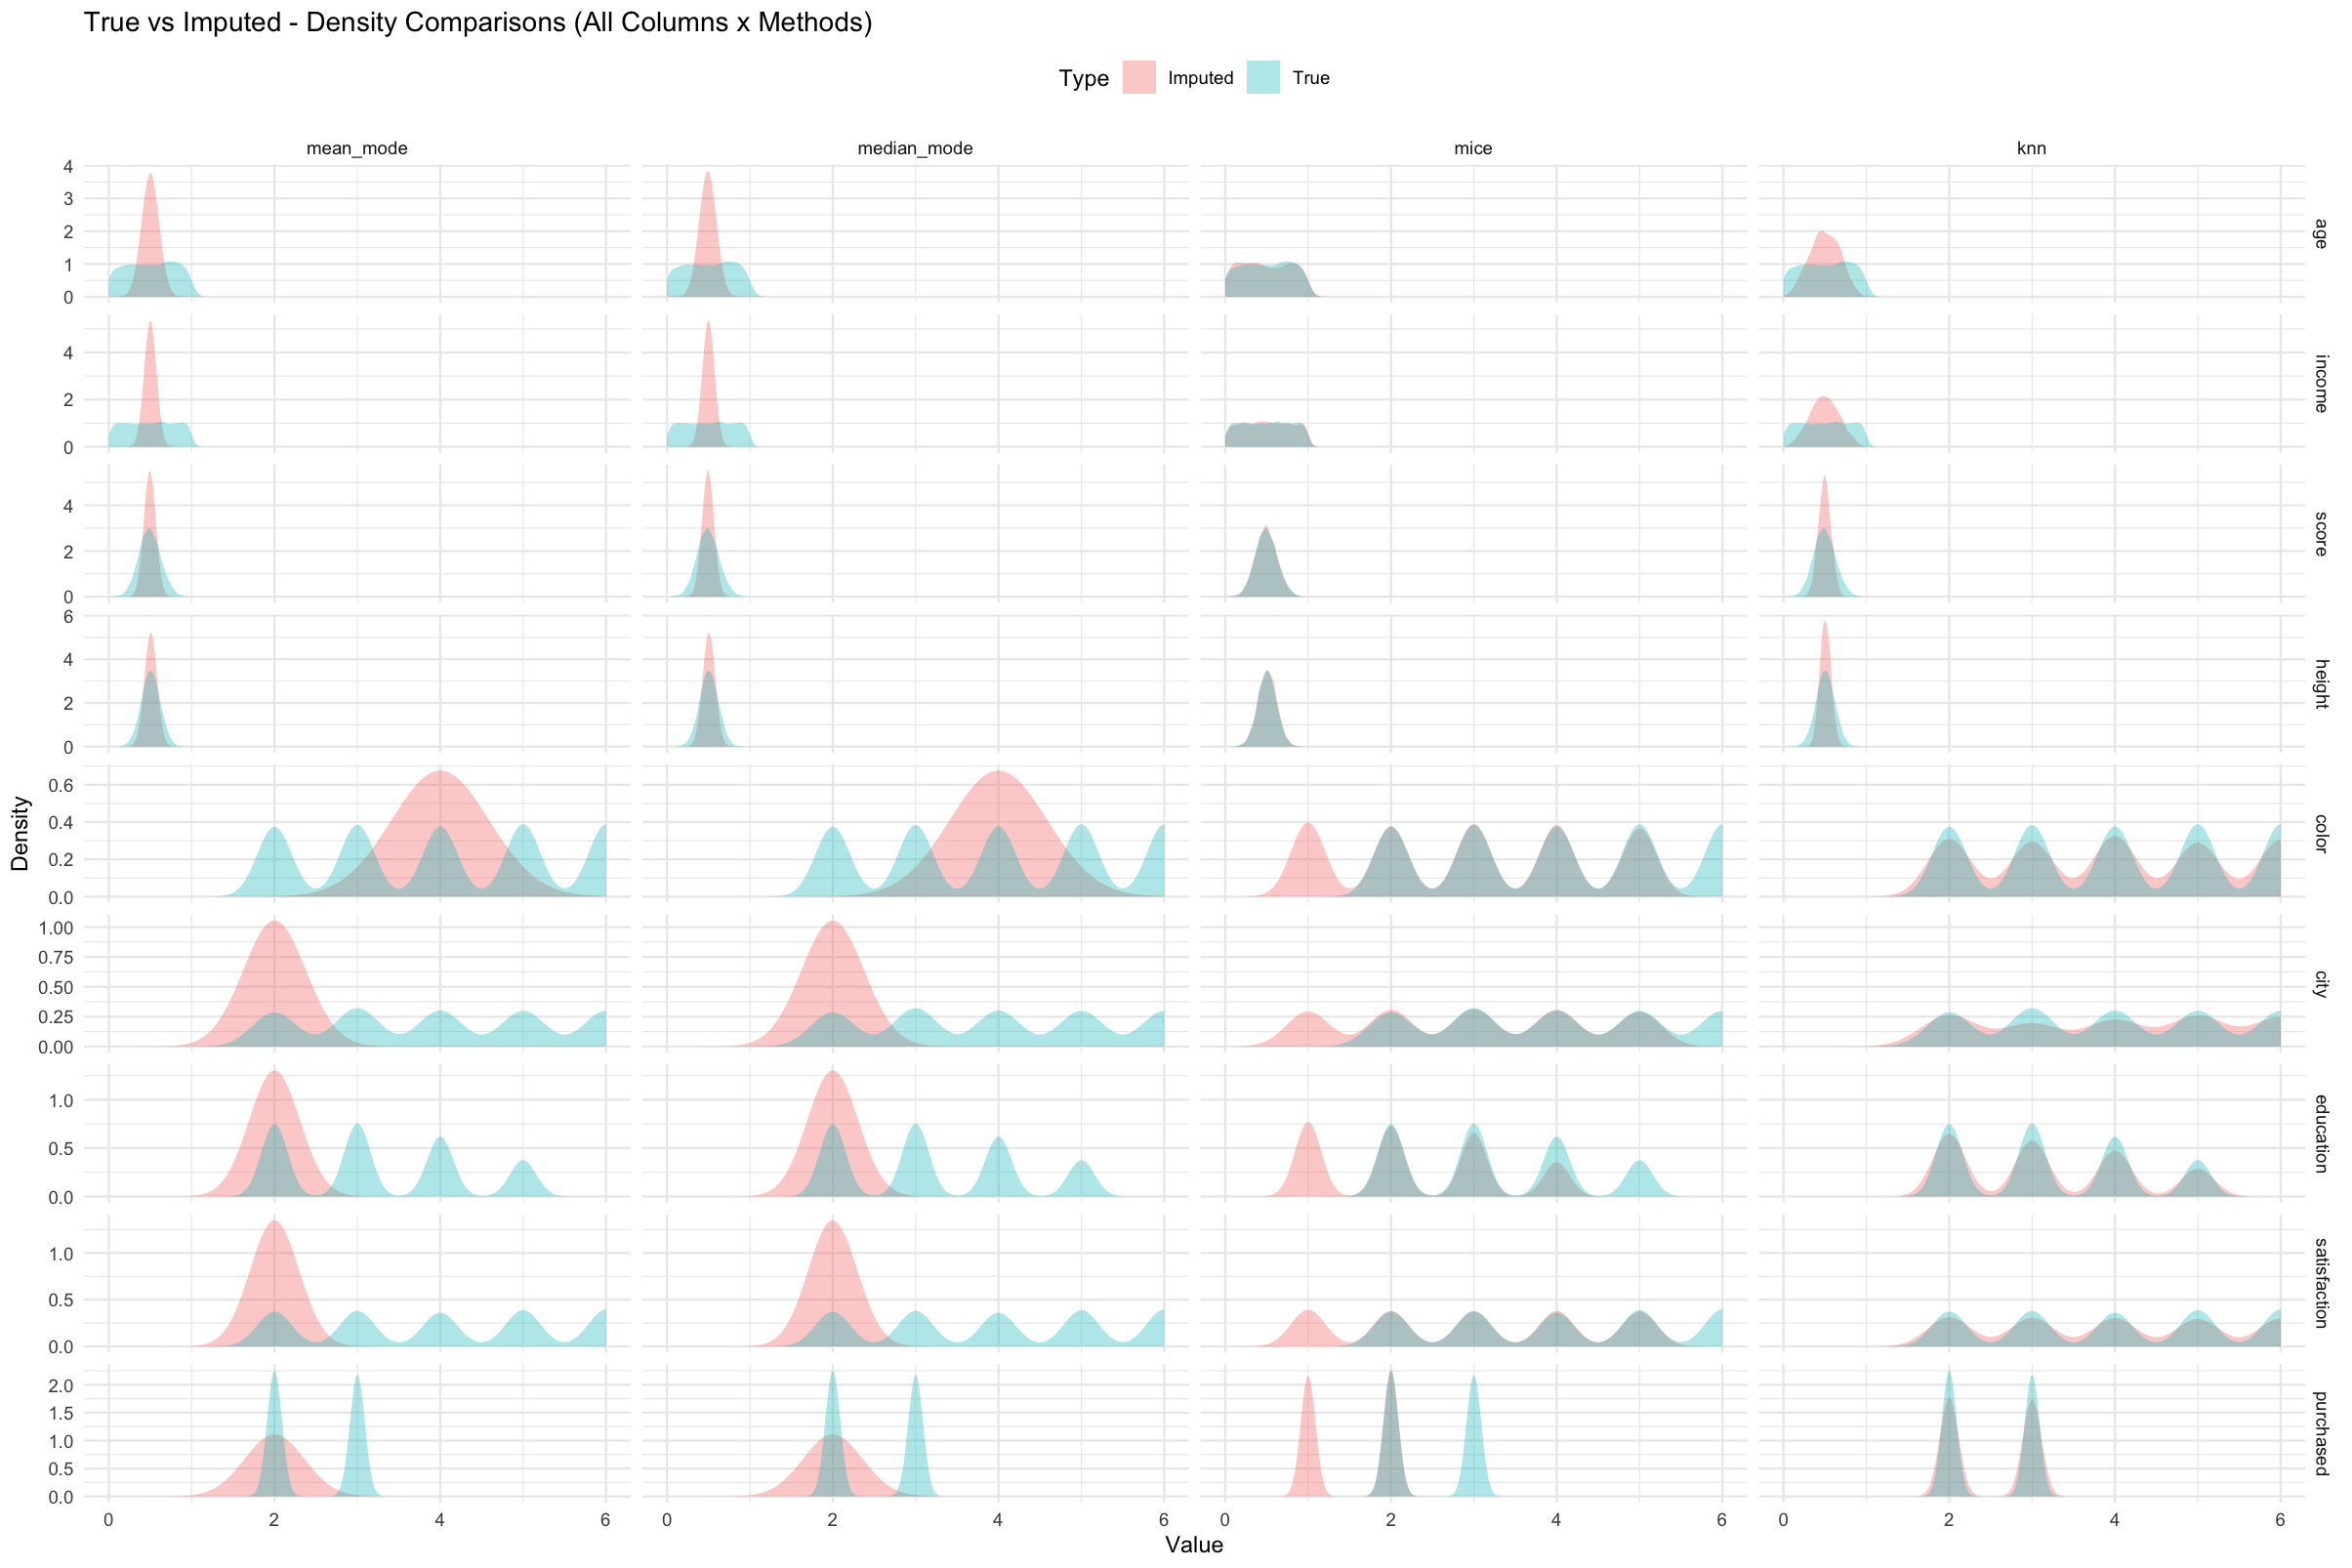
Figure 2. True (blue) and imputed (red) value distributions
across all numeric variables and imputation methods.
Each column represents a method and each row a variable. Greater overlap
between the blue and red curves indicates closer preservation of the
original data distribution.
Evaluation Metrics (Expanded)
| Metric | Definition / Purpose | Better Value |
|---|---|---|
| RMSE | Root Mean Square Error - overall numeric deviation | ↓ |
| MAE | Mean Absolute Error | ↓ |
| R² | Proportion of variance explained | ↑ |
| Correlation | Pearson correlation between true & imputed values | ↑ |
| KS | Kolmogorov–Smirnov statistic - distributional similarity | ↑ |
| Accuracy | Fraction of exact categorical matches | ↑ |
| Kappa | Chance-adjusted agreement statistic | ↑ |
| F1 / Macro F1 | Harmonic mean of precision & recall / class-balanced F1 | ↑ |
| Balanced Accuracy | Mean recall across classes (robust to imbalance) | ↑ |
Example 6 - Full Automated Comparison
evaluate_results(res, metric = "ALL")This wrapper prints summary tables, draws all metric plots, and automatically reports the top-performing imputation methods.
Behind the Scenes
Rcpp C++ Backend
-
evaluate_imputation_split()computes numeric and categorical metrics in C++ for speed. - Numeric metrics → RMSE, MAE, R², Correlation, KS
- Categorical metrics → Accuracy, Kappa, F1, Macro F1, Balanced Accuracy
Parallel KNN Imputation
- Uses
FNN::get.knnx()anddoParallelfor mixed-type parallel processing.
Summary
imputetoolkit now supports split
numeric/categorical evaluation and automated
visualization within one reproducible workflow.
- Unified interface for multiple imputation strategies
- Rcpp-accelerated metric computation
- Parallel KNN for mixed-type data
- Density & metric visualizations
- Best-method recommendations by metric type
Ideal for research, teaching, and benchmarking imputation methods.
Further Reading & Citation
For reproducible examples:
vignette("imputetoolkit")If you use this package, please cite:
Singh, Tanveer (2025). imputetoolkit: An R Package for Evaluating Missing Data Imputation Methods. Victoria University of Wellington.