Overview
imputetoolkit is an R package for evaluating and benchmarking missing-data imputation techniques using a unified R + C++ backend.
It automates the full workflow of data preparation → missingness injection → imputation → metric-based evaluation → visualization, providing both numeric and categorical assessments.
With parallel computation, C++ acceleration, and an intuitive S3 interface (print, summary, plot), the package allows users to quantitatively justify imputation strategy choices.
Key Features
| Category | Description |
|---|---|
| Imputation Methods | Mean/Mode (skewness-aware log transform), Median/Mode, MICE, and mixed-type KNN (parallelized) |
| Evaluation Metrics (Rcpp) | Split into: • Numeric: RMSE, MAE, R², Correlation, KS • Categorical: Accuracy, Kappa, F1, MacroF1, Balanced Accuracy |
| Parallelization | Multi-core KNN imputation using FNN, foreach, and doParallel
|
| Scaling | Min-max scaling of numeric columns for fair metric comparison |
| Visualization | ggplot2-based metric and density plots (per method or all methods) |
| Recommendation | Automatic “best-method” suggestions per metric type |
| Reproducibility | Deterministic pipeline with fixed seeds and consistent outputs |
Package Structure
## Package Structure

imputetoolkit/
├── DESCRIPTION                     # Package metadata (name, version, author, title, description, dependencies)
├── NAMESPACE                       # Auto-generated by Roxygen; lists exported/imported functions
│
├── R/                              # Core R functions
│   ├── evaluator.R                 # Main pipeline: data validation → imputation → metric evaluation (S3 methods defined here)
│   ├── api.R                       # Public-facing wrapper/helper functions (clean user interface)
│   ├── RcppExports.R               # Auto-generated bridge between R and C++ (created by Rcpp::compileAttributes())
│
├── src/                            # High-performance C++ backend
│   ├── evaluator.cpp               # Core metrics computation (numeric & categorical in one pass)
│   ├── imputer.cpp                 # Internal functions for imputation logic and handling mixed data types
│   └── RcppExports.cpp             # Auto-generated by Rcpp — connects compiled C++ to R functions
│
├── inst/extdata/                   # Example data files bundled with the package
│   ├── sample_dataset.csv          # Small mixed-type dataset (for quick testing)
│   └── synthetic_mixed_dataset.csv # Larger synthetic dataset used in vignette + examples
│
├── man/                            # Auto-generated documentation (one .Rd per exported function)
│   ├── evaluator.Rd                # Docs for main function
│   ├── plot_metrics.Rd             # Docs for visualisation helper
│   ├── suggest_best_method.Rd      # Docs for recommendation helper
│   └── ...                         # (Other .Rd files for all exported functions)
│
├── vignettes/                      # Long-form user guide in R Markdown format
│   └── imputetoolkit.Rmd           # Full walkthrough (loading data → imputation → evaluation → plots)
│
├── tests/                          # Unit testing infrastructure
│   ├── testthat.R                  # Entry point for testthat (auto-runs all test files below)
│   └── testthat/                   # Folder containing detailed test files
│       ├── test-evaluator.R        # Tests for pipeline, error handling, and reproducibility
│       ├── test-rcpp-evaluator.R   # Tests for C++ metrics (numeric/categorical accuracy)
│       └── ...                     # (Future tests for new methods or features)
│
├── README.md                       # Main package overview (installation, examples, visuals, and test plan)
├── LICENSE / LICENSE.md            # License declaration (MIT License in your case)
│
├── .Rbuildignore                   # Excludes local/non-package files from build (e.g., .git, .Rproj, docs/)
├── .gitignore                      # Git version control exclusions
│
├── imputetoolkit.Rproj             # RStudio project file (makes package development reproducible)
│
├── _pkgdown.yml                    # Configuration file for your pkgdown documentation website
├── docs/                           # Auto-generated pkgdown site (HTML pages hosted on GitHub Pages)
│   ├── index.html                  # Home page for pkgdown site
│   ├── reference/                  # Function documentation in HTML form
│   ├── articles/                   # Vignettes rendered as articles
│   └── figures/                    # Plot and logo images used in docs
│
└── pkgdown/                        # Static assets for website styling
    ├── extra.css                   # Custom CSS for theme styling
    └── favicon/                    # App icons (favicon, apple-touch-icon, etc.)
Core Functions
evaluator()
Main pipeline that executes: 1. Data loading or input validation
2. Missingness injection
3. Imputation via all four methods
4. Metric evaluation (numeric & categorical)
5. Return of structured evaluator objects
Returns:
list(mean_mode, median_mode, mice, knn)Each object contains:
S3 Methods
-
print.evaluator()– concise summary by metric type -
summary.evaluator()– per-column and aggregated results -
print_metrics()– combined table across all methods -
plot_metrics()– ggplot visualization for any metric -
suggest_best_method()– identifies top-performing methods -
evaluate_results()– runs print + plot + recommendation -
get_eval_list()– extracts true/imputed pairs for density plots -
plot_density_per_column()/plot_density_all()– visualize true vs imputed distributions
C++ Backend (evaluate_imputation_split.cpp)
Efficient Rcpp backend that calculates both numeric and categorical metrics in one pass.
Unit Tests (tests/testthat/)
Comprehensive suite covering:
| Test Area | Focus |
|---|---|
| Pipeline | Verifies all 4 imputation methods run successfully |
| S3 Methods |
print, summary, and invisibility checks |
| Wrapper Functions |
extract_metrics, plot_metrics, suggest_best_method
|
| Error Handling | Invalid inputs, unsupported file formats |
| Reproducibility | Consistent metrics with fixed seed |
| Parallel KNN | Multi-core execution validation |
| C++ Evaluator | Direct unit tests for numeric/categorical metrics |
Example:
[ FAIL 0 | WARN 1 | SKIP 0 | PASS 76 ]Installation
Requires R ≥ 4.0, Rtools, and compilation support for Rcpp.
Install from GitHub
install.packages("remotes")
remotes::install_github("tanveer09/imputetoolkit@main", build_vignettes = TRUE, INSTALL_opts = c("--install-tests"))Dependencies
Before installation, ensure the following R packages are installed:
install.packages(c(
  "Rcpp", "FNN", "mice", "ggplot2", "dplyr",
  "knitr", "rmarkdown", "testthat", "foreach", "doParallel"
))
Example Usage
1. Load Data
file <- system.file("extdata", "synthetic_mixed_dataset.csv", package = "imputetoolkit")
raw_data <- read.csv(file, stringsAsFactors = TRUE)
2. Run the Evaluator
res <- evaluator(data = raw_data)4. Compare All Methods
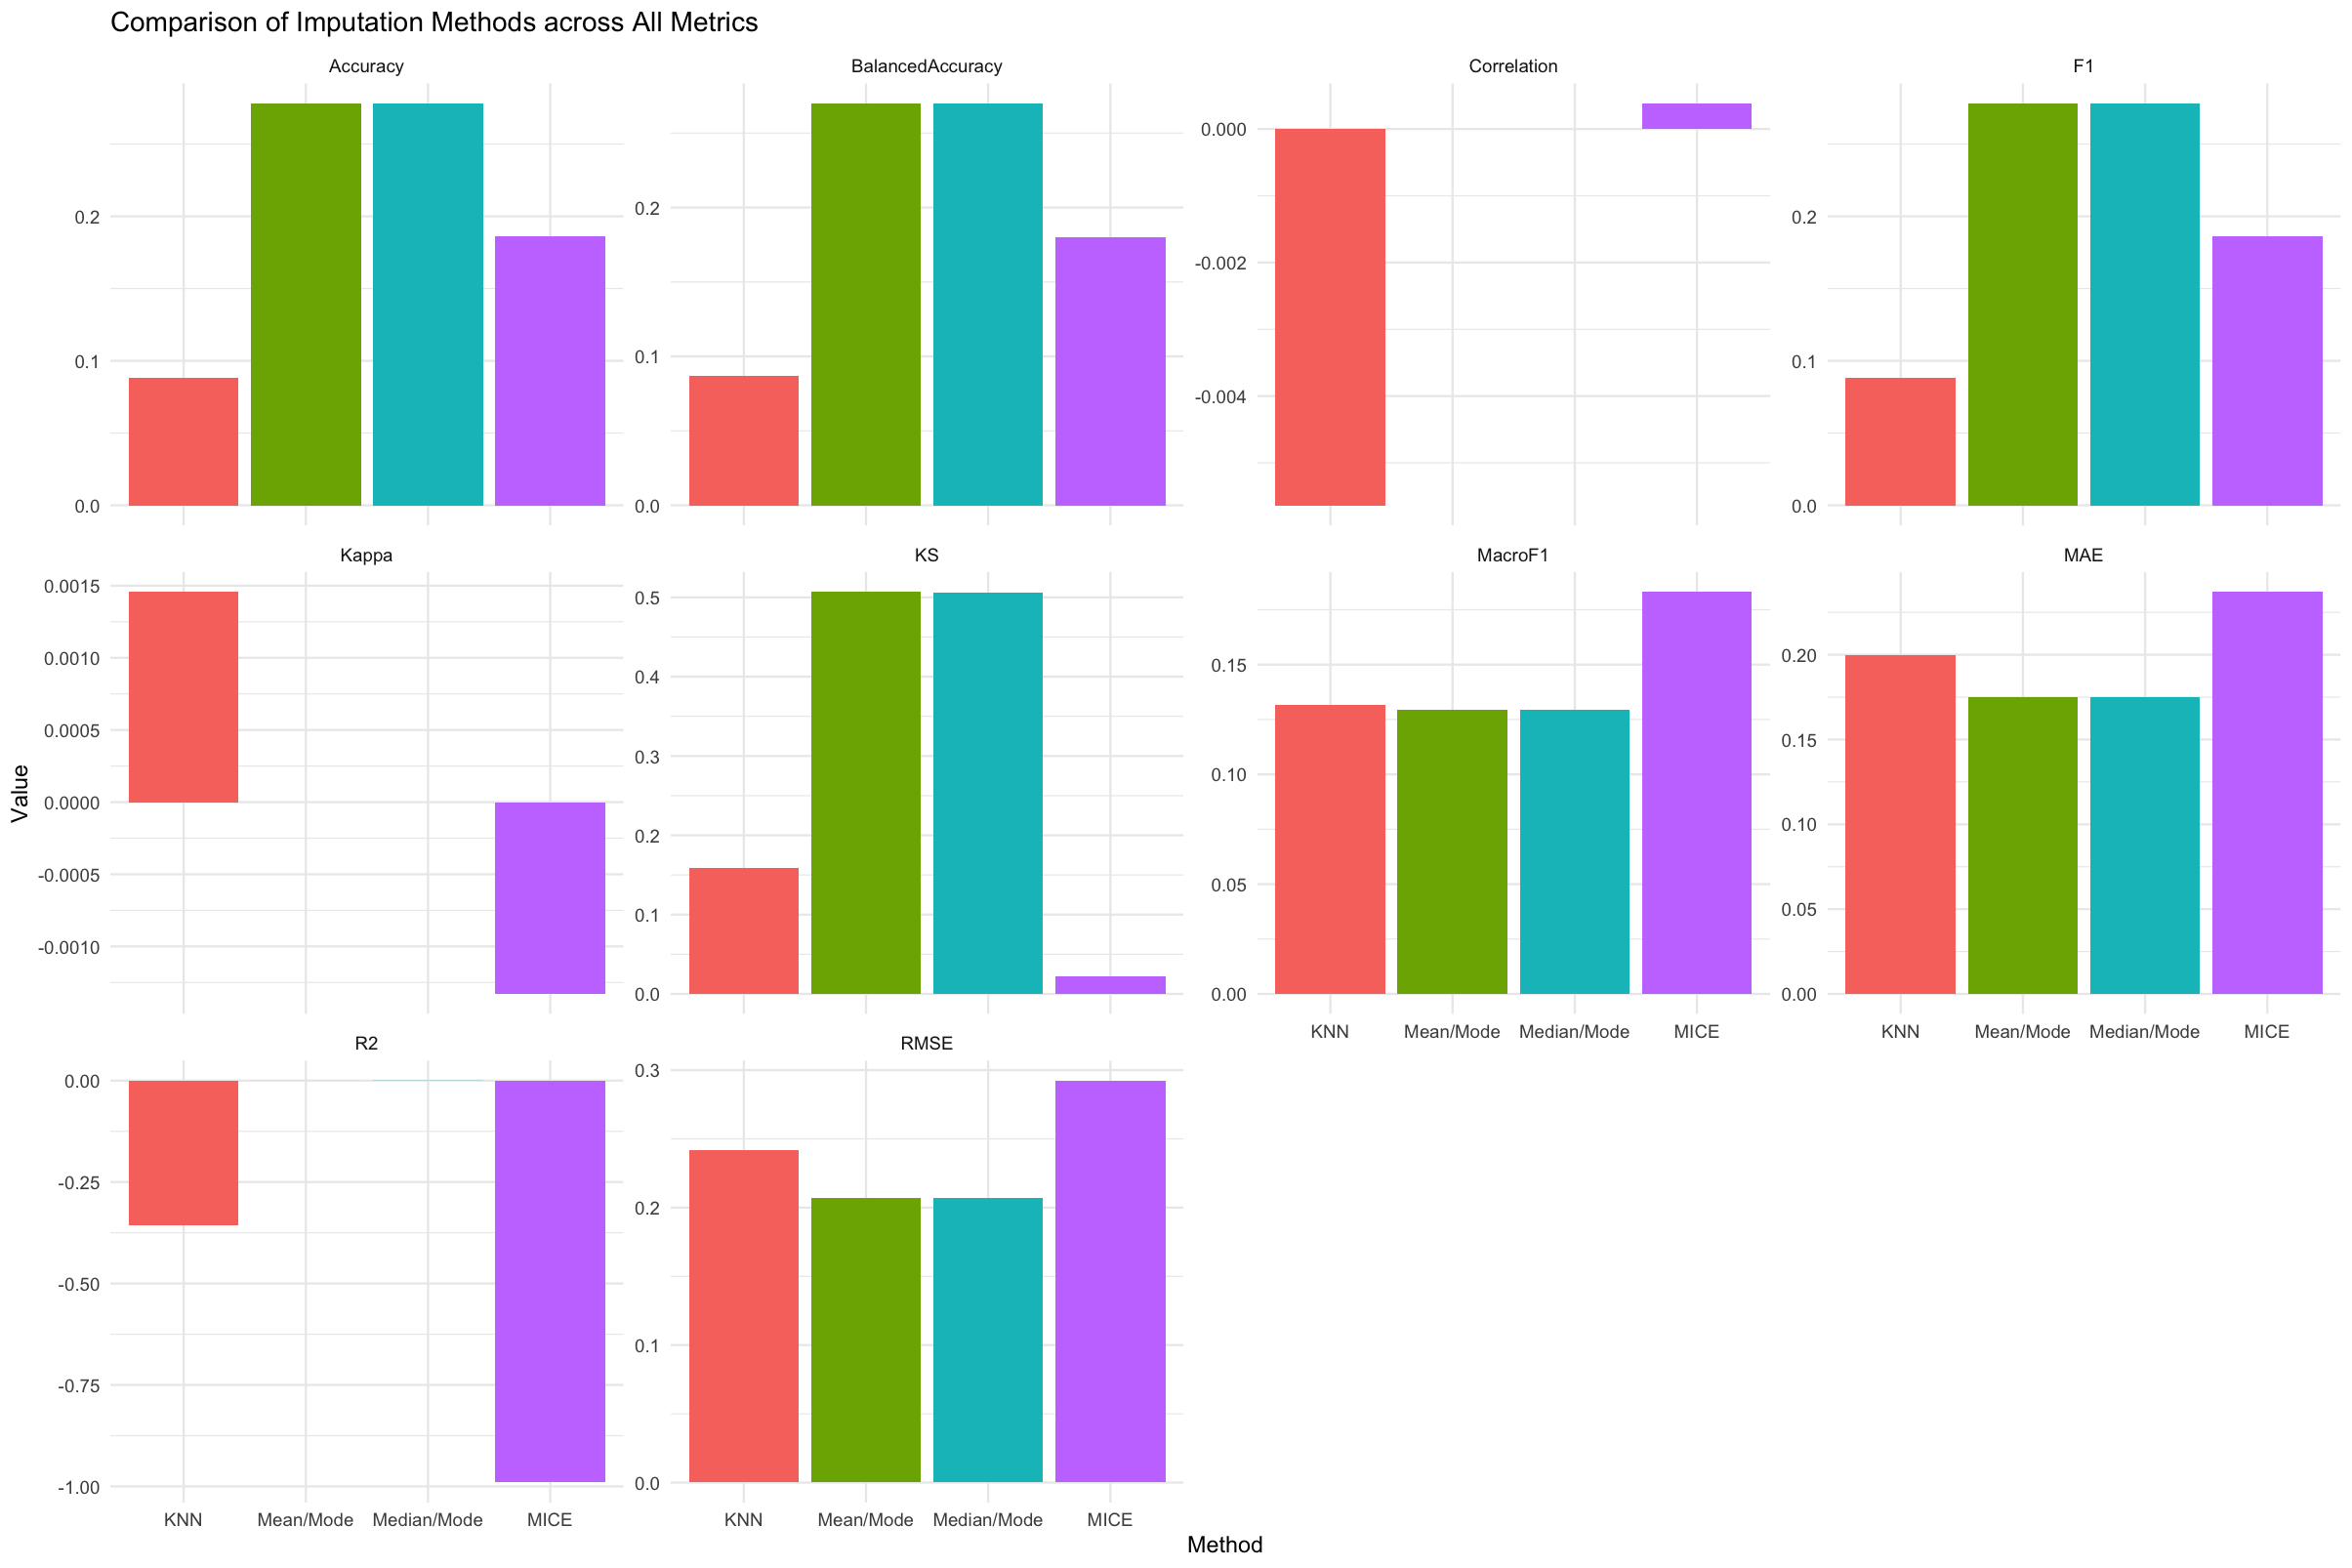
print_metrics(res)
plot_metrics(res, "ALL")
5. Suggest the Best Method
suggest_best_method(res, "ALL")Example output:
Numeric Columns:
     Best imputation method as per "RMSE, MAE, R2, KS" metric: Mean/Mode
     Best imputation method as per "Correlation" metric: MICE

Categorical Columns:
     Best imputation method as per "Kappa" metric: KNN
     Best imputation method as per "Accuracy, F1, BalancedAccuracy" metric: Mean/Mode
     Best imputation method as per "MacroF1" metric: MICE
Example Visuals
 )
)
Density Comparison
eval_list <- get_eval_list(res)
plot_density_per_column(eval_list, "age")
plot_density_all(eval_list)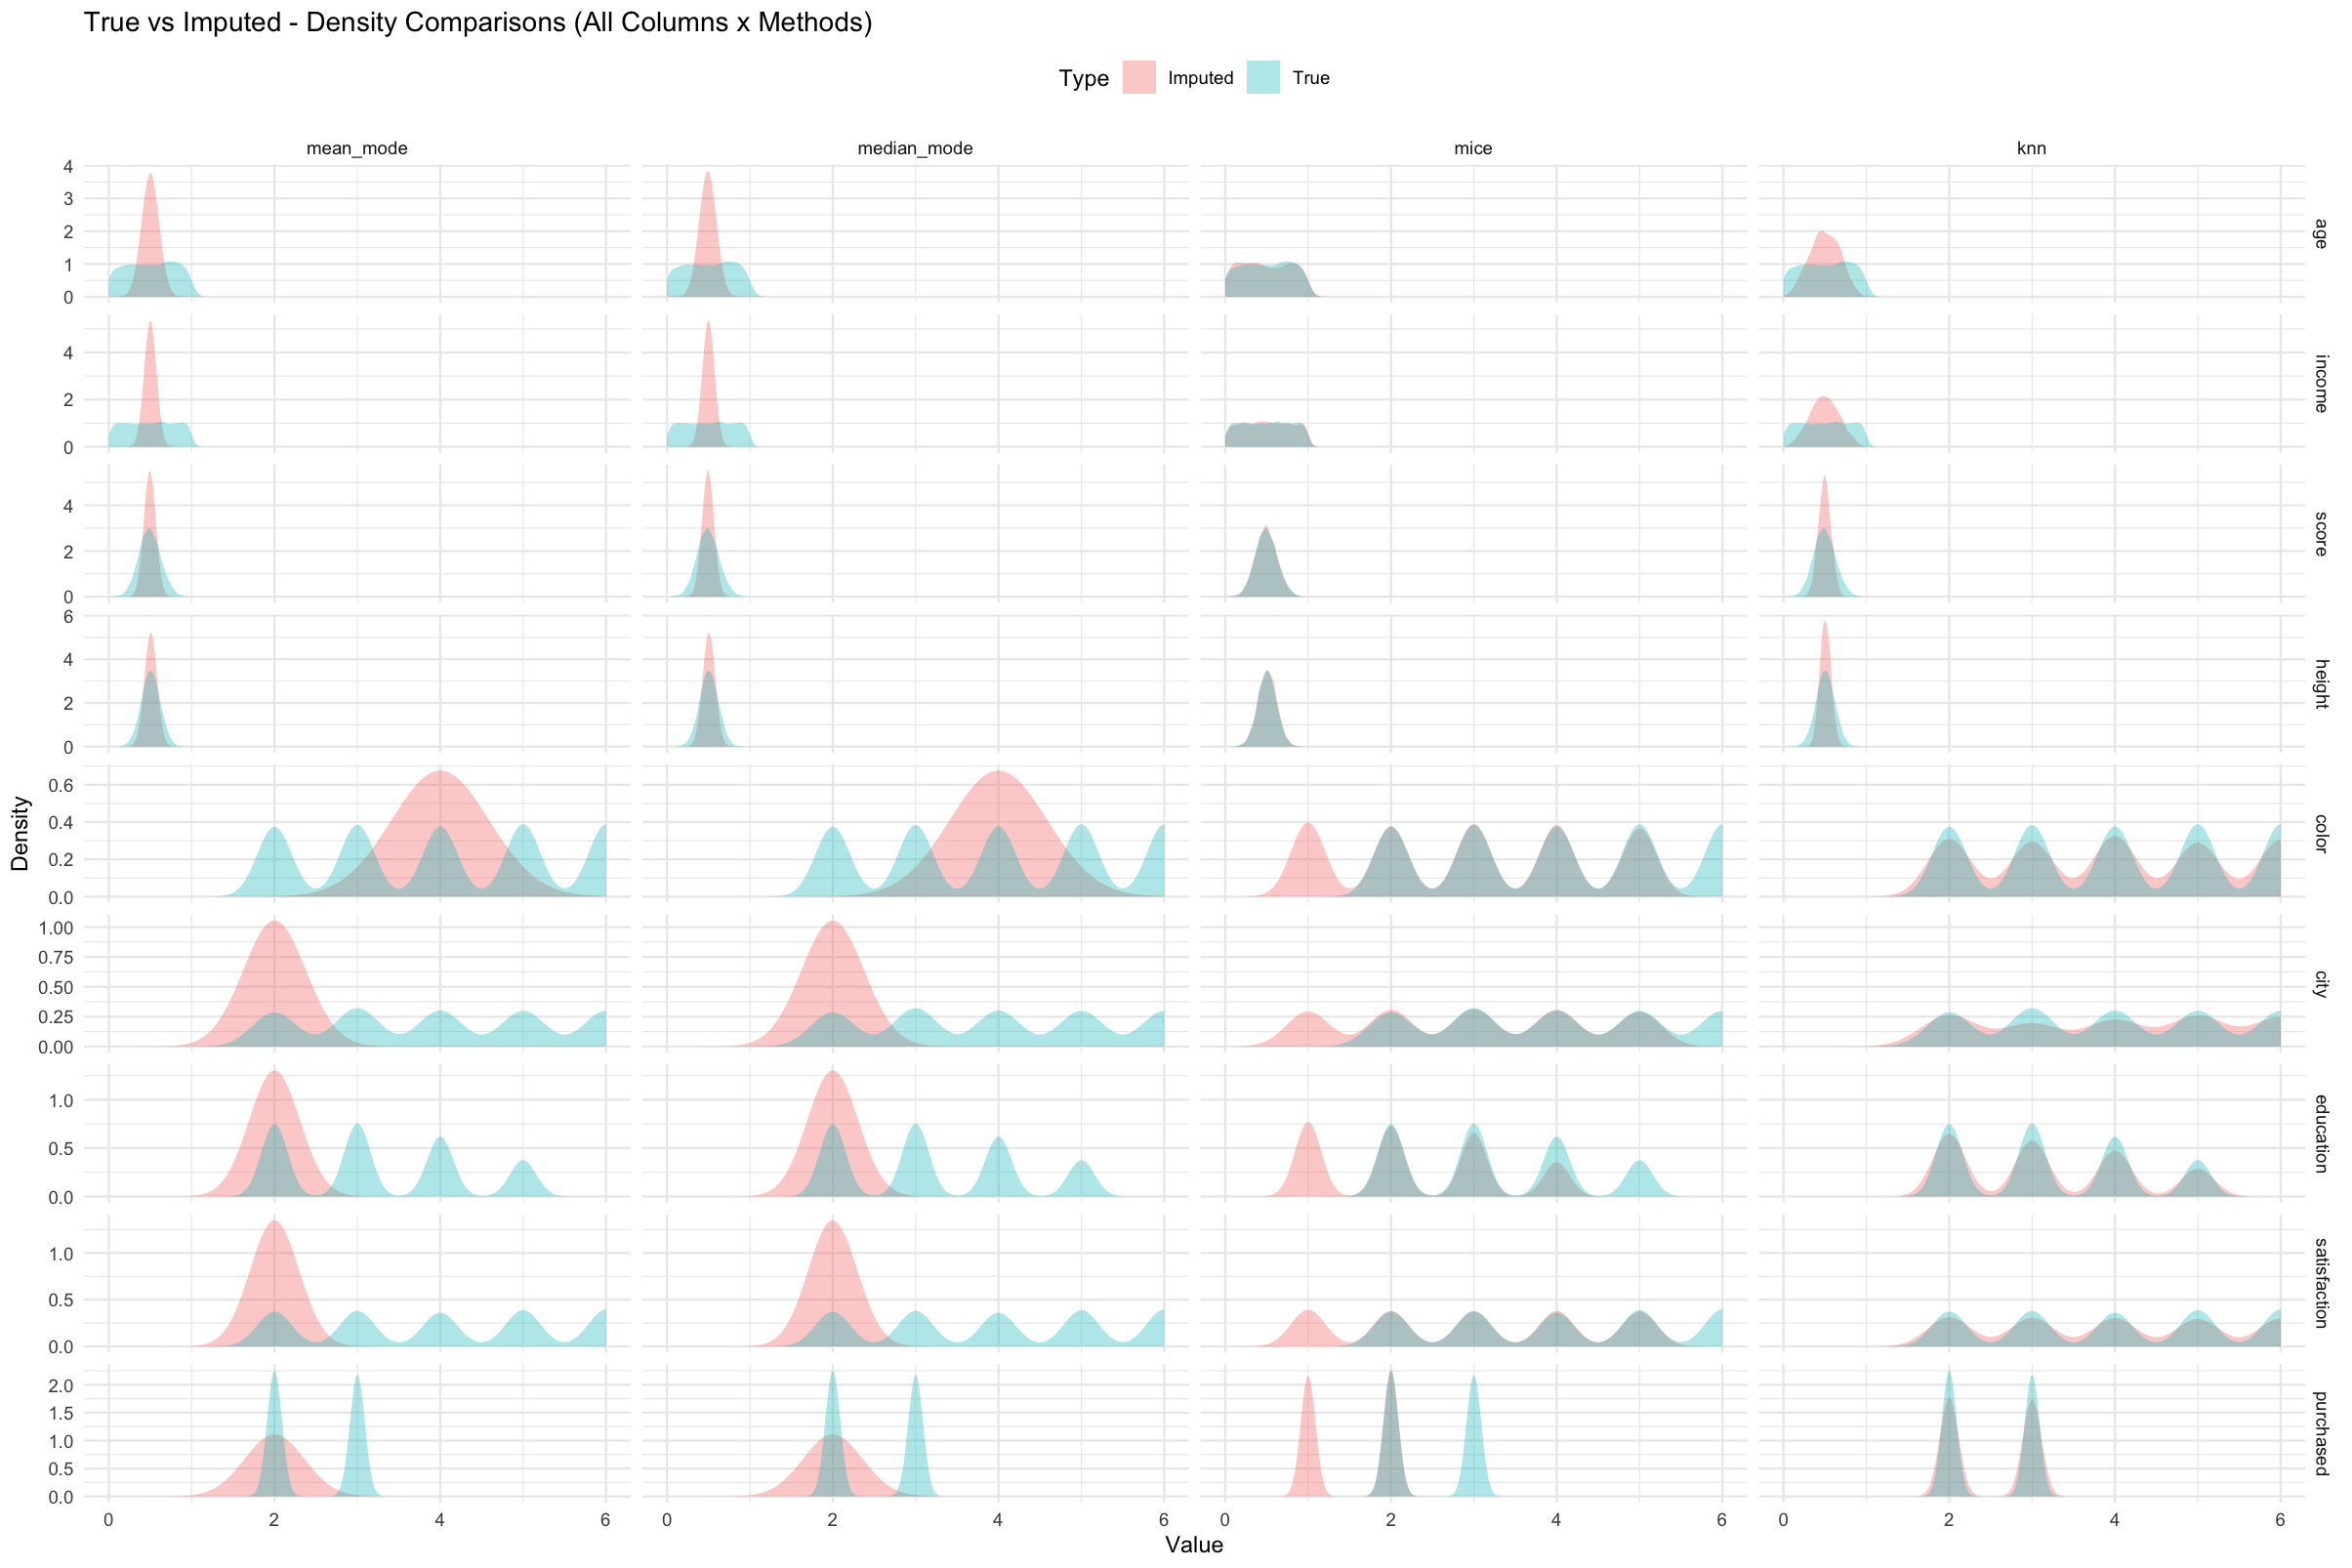
Evaluation Metrics Summary
| Metric | Type | Goal | Description |
|---|---|---|---|
| RMSE | Numeric | ↓ | Root Mean Squared Error |
| MAE | Numeric | ↓ | Mean Absolute Error |
| R² | Numeric | ↑ | Variance explained |
| Correlation | Numeric | ↑ | Pearson correlation |
| KS | Numeric | ↑ | Distribution similarity |
| Accuracy | Categorical | ↑ | Exact match rate |
| Kappa | Categorical | ↑ | Chance-corrected agreement |
| F1 / MacroF1 | Categorical | ↑ | Balance between precision & recall |
| BalancedAccuracy | Categorical | ↑ | Mean recall per class |
Additional Features
- Split-metric evaluation: numeric and categorical metrics handled separately.
- C++ acceleration: high-performance evaluation with safe NA handling.
- Parallel KNN: multi-core computation for mixed-type datasets.
- Skewness-aware mean imputation: applies log + geometric mean for |skewness| > 1.
-
Reproducible pipeline: consistent metrics across runs (
set.seed()used). - Custom plotting: side-by-side bar charts, density overlays, and panel comparisons.
Documentation
- Function references:
?evaluator,?plot_metrics,?suggest_best_method - Vignette tutorial:
vignette("imputetoolkit") - Online docs: pkgdown site
Test Plan
This section provides a detailed plan for testing the imputetoolkit package. Follow the steps in order. Each step includes the purpose, example commands, and the expected outcome. This plan allows reviewers to verify both functionality and error handling.
1. Environment Setup
Steps:
1. Install remotes (if not already installed):
install.packages("remotes")2. Install the package from GitHub (recommended command):
remotes::install_github(
  "tanveer09/imputetoolkit@draft",
  build_vignettes = TRUE,
  INSTALL_opts = c("--install-tests")
)
This command builds vignettes and installs all test files automatically. If the package was already installed, reinstall using the same command to ensure tests are available.
4. Check vignette availability:
browseVignettes("imputetoolkit")Expected outcome: At least one vignette appears, linking to the HTML vignette documentation.
2. Data Requirements
Requirements:
Your dataset should:
- Contain at least one numeric and/or categorical variable.
- Include some missing values for imputation.
- Have no constant or identical columns.
- Avoid extremely small datasets (fewer than ~5 rows), as MICE may fail due to collinearity.
Example:
filename <- system.file("extdata", "sample_dataset.csv", package = "imputetoolkit")
raw_data <- read.csv(filename, stringsAsFactors = TRUE)
head(raw_data)
Expected outcome: A dataframe similar to the example below, with some missing values.
| age | income | score | height | color | city | education | satisfaction | purchased |
|---|---|---|---|---|---|---|---|---|
| 56 | 126091 | 51.19 | 166.1 | Red | DAL | High School | Neutral | Yes |
| 46 | 129500 | 52.75 | 182.1 | Green | LA | Yes |
3. Evaluator Pipeline
Purpose:
Run the evaluator function and confirm that it detects missing values, validates inputs, and produces results.
Expected outcome: A list with elements "mean_mode", "median_mode", and "mice".
Example failure case:
-
If the dataset has no missing values, the function prints:
“No missing values detected. Please provide data with missing entries.”
-
If both
dataandfilenameare provided, message:“Both data and filename provided — using data input and ignoring filename.”
4. Inspect Individual Results
Purpose:
Validate print and summary outputs for each imputation method.
4.1 print()
print(results$mean_mode)Expected: Displays global metrics (RMSE, MAE, R², Correlation, KS, Accuracy).
4.2 summary()
summary(results$mean_mode)Expected: Returns a per-column metrics data frame and a “GLOBAL” summary row.
5. Compare Methods
Purpose:
Confirm comparative visualization and tabular summaries of metrics.
5.1 print_metrics()
print_metrics(results)Expected: Table comparing all imputation methods by metric.
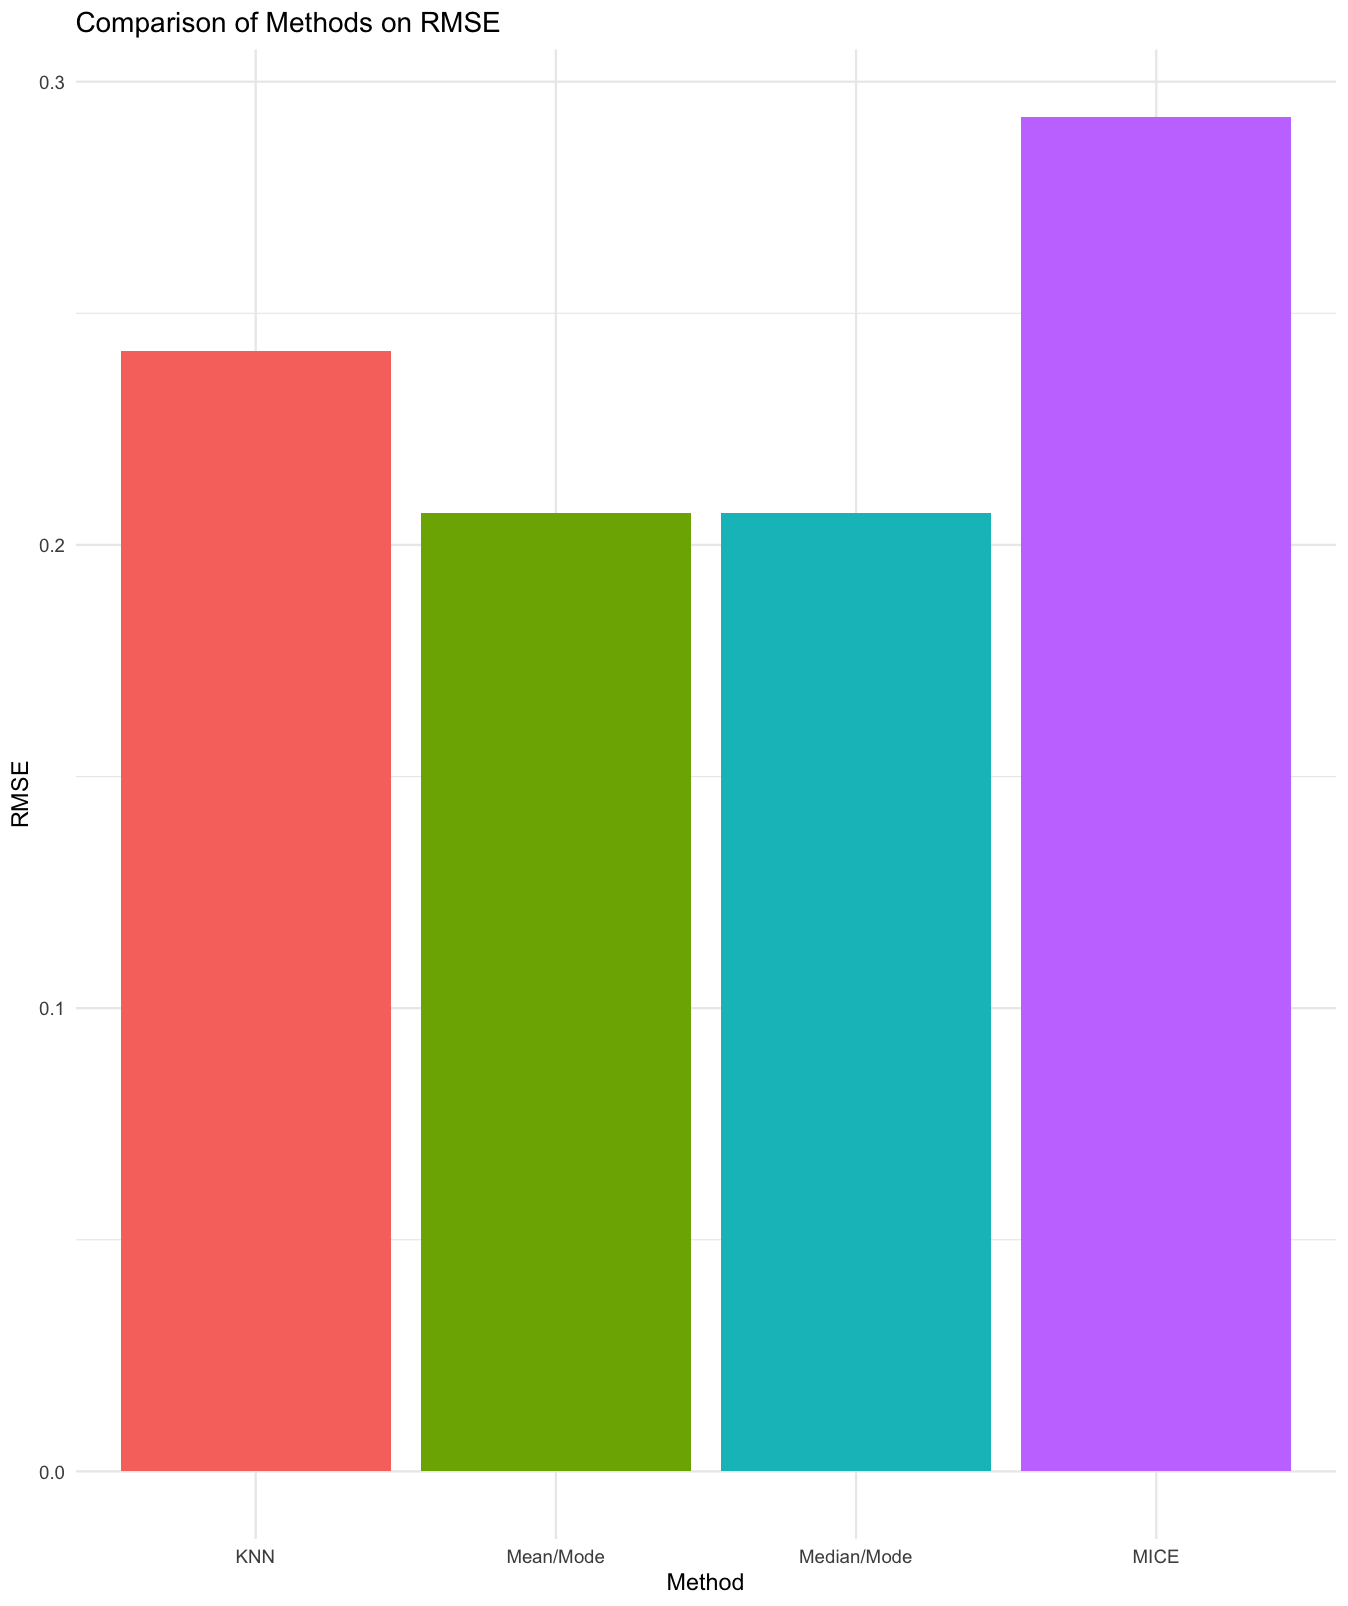
5.2 plot_metrics()
plot_metrics(results, "R2")Expected: Facetted bar chart comparing methods by the selected metric.
6. Suggest Best Method
Purpose:
Check that the helper correctly identifies the top-performing imputation method(s).
output <- suggest_best_method(results, "ALL")Expected: Displays methods performing best for each metric (R², KS, RMSE, etc.).
7. Vignette Validation
Purpose:
Ensure the vignette compiles successfully and demonstrates the full workflow.
browseVignettes("imputetoolkit")Expected: Vignette opens and runs without errors, showcasing data loading, imputation, and evaluation.
8. Error Handling
Purpose:
Test robustness and clarity of error messages.
Expected outcomes:
Missing arguments → “Please provide either a filename or a data.frame.”
Invalid file path → “File not found: fake.csv”
Small dataset / constant variables → “MICE imputation failed: dataset may be too small or contain collinear variables.”
10. Run Unit Tests
Purpose:
Execute all built-in unit tests to confirm functionality.
library(testthat)
test_package("imputetoolkit")
Expected outcome:
[ FAIL 0 | WARN 1 | SKIP 0 | PASS 76 ]Development Notes
- Modular design: easy extension for new imputation algorithms (e.g. missForest, EM).
- Full
testthatcoverage with >50 passing tests. - Fully vectorized Rcpp implementation.
- Works seamlessly with
knitr/rmarkdownfor reproducible reports.
Feedback and Contributions
Feedback, feature requests, or bug reports are welcome via the Issues page.